Connexion

SEO + AEO = Organic Answers Optimization [OAO] Analytics
It is time for a new acronym to enter the marketing lexicon: OAO.
We have lived in the Search Engine Optimization (SEO) world for the longest time – it remains critically relevant. Many of us have embraced the new demands of Answer Engine Optimization (AEO). [I’m sorry, I’m not a fan of Generative Engine Optimization (GEO) because that honors the technology and tech changes all the time.]
Organic Answers Optimization, bringing the two worlds together… Because they really are one thing now.
Big brother SEO is still dominant – most traffic, most revenue. Little brother AEO has “stolen” “market share” in the consumer influencing game (no need to come to our sites ☹️), has started to drive modest scale in traffic and a surprising scale in profit.
Practitioners in each space fight surprisingly passionately to preserve their respective SEO and AEO domains. It. Is. Ok.
For me, the business person, it is now just one thing:
My SEO work drives AEO, and AEO drives SEO. The brothers (or sisters, if you prefer), united in strategy, execution, tactics, impact, and analytics.
Different “machines,” one quest: Organic Answers Optimization!
It makes it easier to make peace with this:
Your SEO traffic is likely down 20%-30% YOY (as I predicted!).
Your AEO traffic is up from 0% to 2% (as I predicted).
Overall “organic” revenue is down (unless you did most of the 12 SEO and 8 PPC recommendations, in which case Rev up ~10%).
I want to bring these two together, from a business perspective, because “organic” deserves extra special attention. Even bigger declines in traffic are on their way.
Context for Change.
Around this time last year, I wrote a six-part (!) series on AEO, AEA (Analytics), and a three-part series on how to identify the upcoming losses, take actions for recovery, and compute the financial impact.
[Annual Premium Subscribers: I have converted all this into an updated 114-page Answer Engine Playbook! If you would like the PDF version of the mini-book, please email me.]
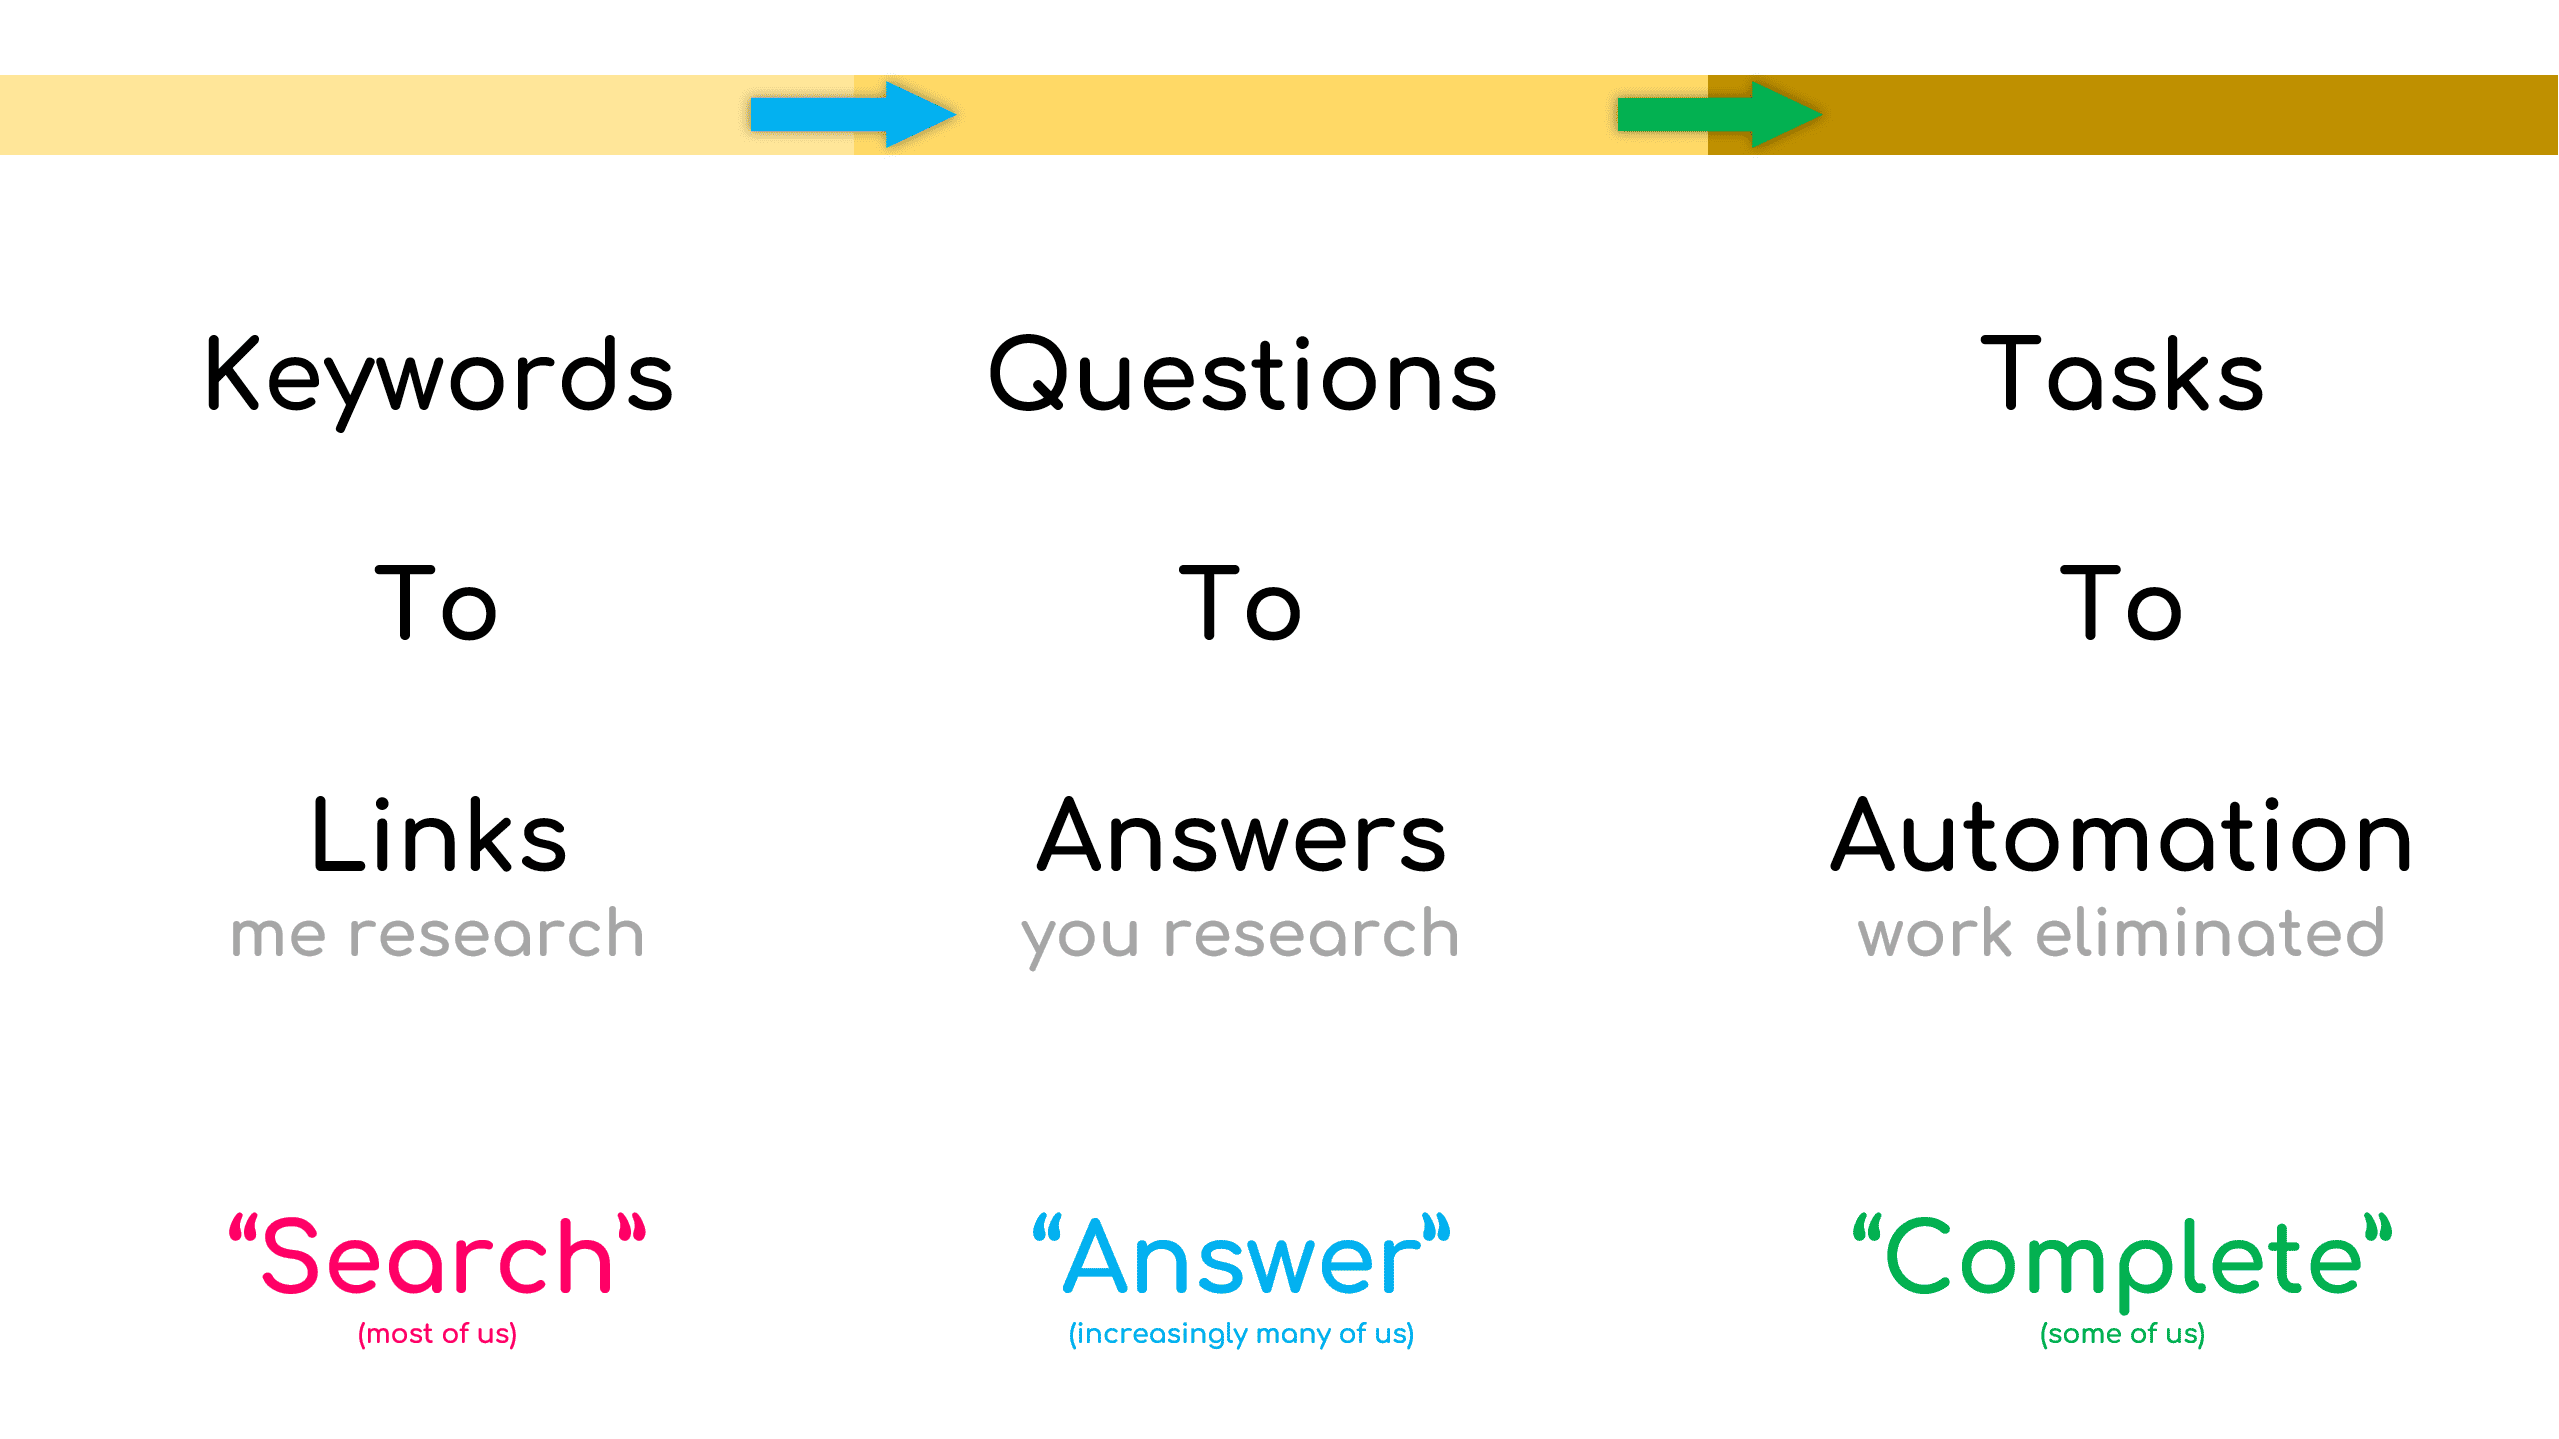
In a keynote I subsequently delivered, this picture captured the evolution:
Let’s say I have an upcoming trip to Prague.
Search
Old-school search would have me going to Big Google and searching for “lightweight carry-on luggage.” I’ve been patterned to use keywords to get back three paid links and ten organic links, and then head off on a research mission to find the right suitcase.
Most of us do this (a billion plus).
Answer.
Along with approx. 50% of GenZ who use an LLM every day, I stopped doing searching 18 months ago. I now pop open ChatGPT and type “ I need a light carry-on for a ten-day trip, with a small European airline connection, for under $250. I also need a backpack that I can stuff with extra clothes and a laptop, to go with the bag that the small EU airline will allow me to carry on.” Astra (my GPT model) is now off to the races, and 17 seconds later I have my answer. No research, no sweating.
A few hundred million of us, skewing young, are doing this.
[Bag: Travelpro Maxlite International Carry-on Spinner. Backpack: CabinZero Classic Tech 28L. Both look amazing. I’d never heard of CabinZero: the discovery power of an LLM.]
Complete.
Increasingly, I skip the buying part customers doent do it. Same context-rich query as above, but I might add “ …buy the first recommendation for each, confirm it will arrive by Oct 30th, from a site with a clear returns policy.” Often, the purchase shows up. Sometimes the site blocks my Agent from buying, so it adds to cart and sends me the link.
1% to 2% of us are doing this.
The world is moving right, because why would a human need to spend time hunting and gathering, the meal can arrive all caught, plucked, seasoned, and cooked?*
With Dots and Muse, the pace will pick up.
*Some people find joy in shopping; they will continue to have this option!
Why One OAO Scorecard.
Your customer does not care if they used Old Google or used an Answer Engine. For them, they were just seeking, and they found what they wanted.
[Per SparkToro, approx. two-thirds of US Google searches end without a click.]
Your CFO does not care about Old Google or Claude or Qwen. They care that we are chosen and get revenue.
[Per Adobe, with a trillion US retail visits analyzed, LLM-driven visits deliver 53% more revenue per visit than other channels. Per Shopify, LLM-driven visits convert approx. 50% better than Organic Search.]
Your Marketing team does care because you have an SEO team/agency and, if you read my mini-book, have a raft of AEO initiatives in your Content team. And these are silos today because the work used to be different. SEO, which you already know all about, had an emphasis on 1P and text plus images. AEO was built on that strong foundation, and added an emphasis on 3P and video plus audio.
As customers delegate more, a visit to your website becomes a less complete record of your influence. Hence, pulling it all into one scorecard will provide a fuller view of influence, and create incentives for your silos to break.
One more reason… For now, the first strong commercial results from your “AEO” efforts will flow in through your “SEO” traffic. Unification helps here too.
Meet Kettle & Loom.
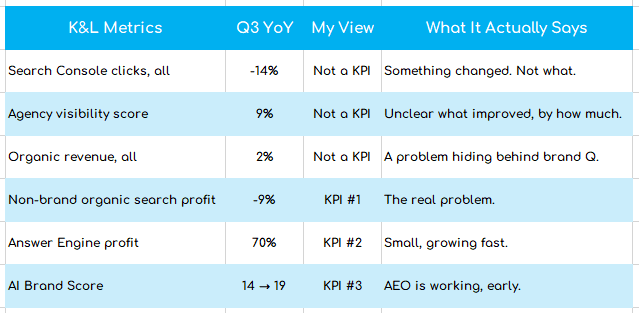
Learning is better when we have an actual use case. Kettle & Loom is a made-up home goods retailer. K&L’s CMO was given a report with three numbers:
1. Search Console Clicks: -14%
2. Agency Visibility Score: +9%
3. Organic Revenue: +2%
Is that good? Bad? Yes. 😊 Let’s learn.
OAO Analytics Methodologies.
For our unified scorecard we need metrics. BUT. Methodologies trump metrics!
Let’s do that first.
There is no one ring to rule them all. At this stage, we will have to pick and choose from a basket – and there is a lot of “variable” quality out there.
Your owned systems (GA, CRM, ERP) describe visits, behavior, sales and profit, mostly to entirely accurately. Search Console describes observed Google Search performance – often aggregated or hidden for privacy reasons. Competitive tools estimate things about other sites that your analytics can’t see – hence, they’re best for comparison, never for raw numbers.
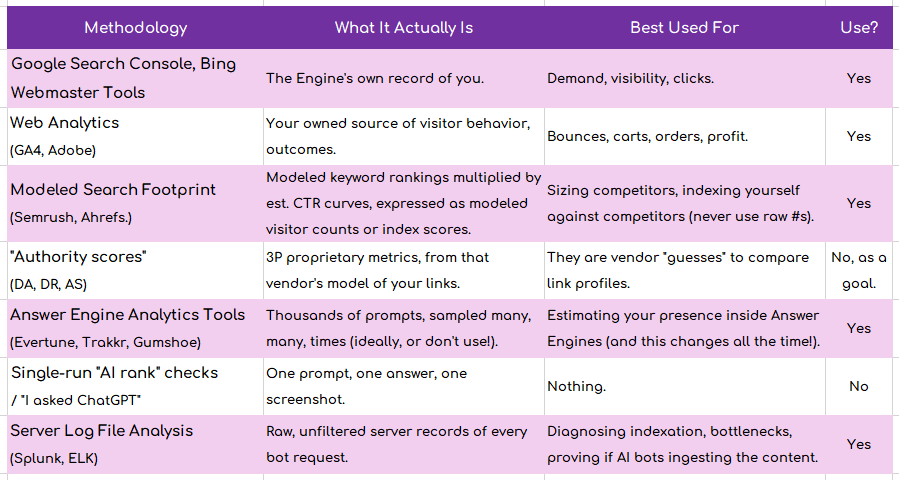
It is important to reflect on methodologies carefully because it really is a case of GIGO. And, in our world of immense scale, it is more like garbage in, landfill out.
It is particularly critical for Answer Engine Analytics tools as they are so new. Investigate how they collect data. [Premium Subscribers please see: TMAI #472: AEA Methodologies & KPIs. If you can’t find it, please email me.]
There is a lot of snake oil out there. Ex: Some vendors claim, or STRONGLY imply, that they have full access to actual prompts typed by users of LLMs. That is simply a lie.
Panels of a few mil can be somewhat useful at extremely aggregated levels. Ex: Industry. Even by category in an industry, it falls apart. For a single brand in a category in an industry, it is just crap.
Even a large panel will see 0.01%, or significantly less, of ChatGPT’s July 2025 publicly stated 2.5 billion prompts. For every MILLION times a question is asked about your category, a vendor claiming “tens of millions of prompts captured” will catch about 100, and only single digits, at best, will be about you. Worse news? The monthly “search volume” of any one prompt is effectively one.
One day we might have “Claude Webmaster Tools,” or “OpenAI Seeking Console,” but until then… no dice.
SEO also has issues we have learned to be careful about. Marketers constantly mistake estimated traffic, authority scores, and visibility indexes – all proprietary vendor guesses – for Google’s actual ranking mechanics (falling victim to Goodhart’s Law).
K&L’s Agency Visibility Score of +9%? Their vendor’s model of rankings * estimated clicks. Some value in comparing against direct competition. It is not proof of any extra dollars.
Everything in AEO for now, at least, is a “long tail query,” but we also don’t get such queries from Google – these hidden rare queries add up to nearly half of all clicks (Ahrefs). 3P SEO tools that “model” this long tail data should be viewed with suspicion. Google now mixes AI Mode questions into the same report, unlabeled (and rare, hence, more likely than not, hidden).
K&L’s -14%? Real clicks. But brand and non-brand are blended. AI Mode sits inside, unlabeled, and nearly half the queries are hidden. That number is a mush of all that.
Just because a source is not perfect does not immediately mean it is useless. Understand. Use metrics from the methodology at the signal strength it offers.
Humility Note: Organic Answers Optimization is funneling demand that in large part was created by brand advertising, distribution, seasonality, word of mouth, yada, yada, yada.
K&L’s +2% organic revenue? 50% of it comes from brand searches, and most likely from non-S&A EO initiatives.
Organic Answers Optimization CxO KPIs.
KPIs are metrics that directly impact the bottom line. Typically, they are for people who fund things. They tend to move over months and quarters. They are most influential – or you are doing them right – when they have pre-set targets.
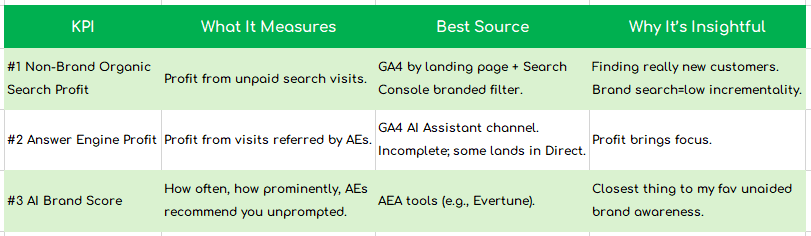
For organic traffic, across all machines, from an ocean of metrics and fuddy counts, I recommend three KPIs (you should rarely have more than three):
KPI #1: Non-Brand Organic Search Profit.
Measures profit from orders (or leads) that began with an unpaid search visit from someone who did not search for your brand/product/service name.
Best source of this data: GA4 by landing page + Search Console branded filter + GA4 AI Assistant channel. It is imperfect, but as good as it gets.
[Premium Bonus: Please see TMAI #521: GA 2026: Unlocking New Value re how to improve GA’s ability to report LLM traffic more accurately using my AI True Traffic Total Kit.]
Why insightful: Following my humility note above, the real job of OAO is to help find and deliver people who didn’t know you – brand demand has extremely low incrementality.
Action recommended: Set targets for this number, then fund SEO initiatives against it (to mostly slow down declines in Organic Search traffic – using, among other things, ideas in my Loss/Recovery spreadsheet model).
Pro-tip: You can translate KPI #1 into Rental Cost. Non-brand organic clicks * what you’d pay per click for the same queries = What it would cost you to rent an asset you own!
KPI #2: Answer Engine Profit.
What it says on the tin.
Best source of this data: Site analytics tools, AI Assistant channel. This is incomplete (mid-Oct ChatGPT decided to change referral strings), and a bunch of it lands in Direct. But. We have to start somewhere.
Why insightful: Is the trend Adobe and Shopify have identified, higher conversion rates and AOV, happening in your case? Profit numbers bring focus.
Action recommended: Use it to gain investments in content (especially video, audio, especially brand, especially 3P). This data can help you persuade your sometimes stubborn, old-school Tech teams to focus on technical AEO, unblock robots and Agents.
Pro-tip: It is really hard to quantify, but most AEO content investments will initially return as a reduction in SEO declines (hence more SEO revenue).
KPI #3: AI Brand Score.
An approximation for how often AEs recommend you, and how prominently, when the question doesn’t include your name. It combines Visibility Score with Average Position.
Best source of this data: From tools like Evertune*, a probabilistic answer gained from repeated prompts to identify a distribution of answers the machines provide. 100 = your brand named first, every time. What’s yours?
What it isn’t: It doesn’t claim to know what your customers type. Nobody knows that.
Why insightful: The number closest to the Most Important Marketing KPI ever: Baseline for Unaided Brand Awareness. You can also think of it as your share of an LLM’s shelf.
Action recommended: I believe the insurance against all the changes coming is my strategy of more content, more places, more often (details in my AEO mini-book). AI Brand Score measures progress against this faith in future influence and revenue. Hence, proof for your CFO that content investments are worthy.
Pro-tip: Tag every major model release on your AI Brand Score chart. A new model can swing you ten points instantly – without changing anything fundamental. Don’t take credit, or blame, for the AI’s homework.
*A long time ago, I made a tiny, tiny, tiny angel investment in Evertune because the team’s awesome.
Let us reflect on K&L’s measurement and apply the lessons above…
The Story Continues in Parts 2, 3.
K&L’s CFO will ask the obvious next question: why is non-brand profit down? Did K&L lose rankings? Did Google keep the click? Or did customers take their questions to LLMs and never click at all?
TMAI Premium #532 built a simple triage process, entirely from data K&L already own. This quickly helps us identify challenges/opportunities each month. The next step is to drill down to diagnostic metrics and influencing variables that K&L’s agency should be acting on. For larger brands, TMAI #533 also pulled out of SEO the contribution AEO makes to reducing declines or increasing growth.
The journey ends with your awesome OAO Analytics dashboard:
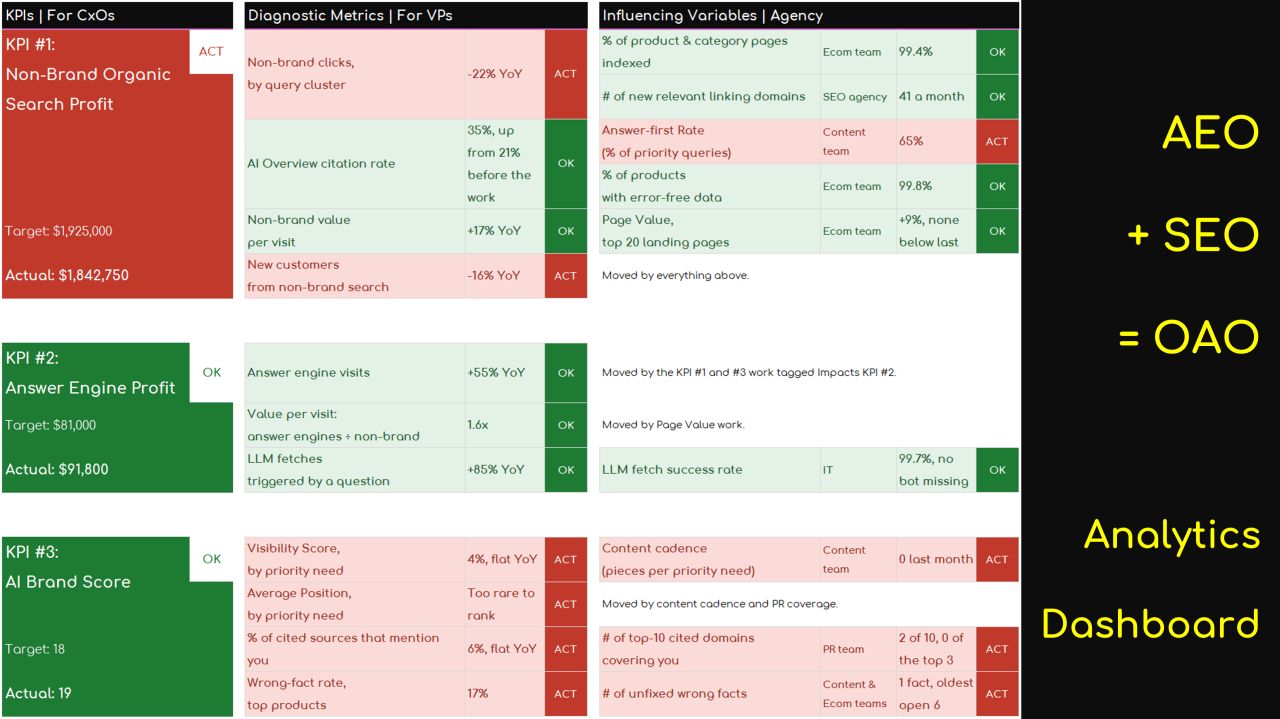
The mini-book worth of stories put together reduces faith required in my OAO strategy of more content, more places, more often – by providing data.
This is the
Premium Subscribers also received an Excel workbook to use across VPs, Directors and agency peers to activate SEO+AEO=OAO revolution. To get a copy sign up here, and reply to the welcome email.
Bottom line.
As humans move from Search to Answer to Complete, the cascading impact on businesses is immense. It’s hard to appreciate for now, because Search remains dominant – especially for older demographics (who have all the money!).
My hope with my little new acronym, OAO, is to encourage a focus on change to ensure change does not catch you by surprise – delivering a business shock.
Faith + Data will prevent surprises.
Carpe diem.