From 10 December 2026, the new Australian Privacy Principle (APP) 1.7 in the Privacy Act 1988 (Cth) will require entities to disclose the use of automated (or substantially automated) decision-making (ADM) in their privacy policies.
Disclosure is required where computer programs are used to make decisions, or do things substantially and directly related to making decisions, that could reasonably be expected to significantly affect an individual’s rights or interests, and where personal information is used in the operation of the computer program.
If the test above is met, APP 1.8 requires the following information to be disclosed:
the kinds of personal information used in relation to the program; and
the kinds of such decisions made solely by the program; and
the kinds of such decisions for which a thing, that is substantially and directly related to making the decision, is done by the program.
On 30 September 2026, the Office of the Australian Information Commissioner (OAIC) published guidance on the forthcoming ADM transparency obligations. Key takeaways from the guidance include the following:
A human decision-maker’s degree of reliance on the computer program’s outputs is relevant. A decision may still fall within APP 1.7 where a program provides recommendations or rankings that are a key factor in the ultimate outcome, even if a human ultimately reviews or approves the decision. Extensive human oversight makes the decision less likely to be captured, and the transparency and explainability of outputs available to the decision-maker are also relevant considerations. Conversely, where the program’s recommendations are rarely overturned or overridden, the decision is more likely to be in scope. Simply having a “human in the loop” does not automatically exclude a decision from APP 1.7.
An output does not need to be the “final” decision. “Substantially” means where the computer program is a key factor in facilitating the human’s decision making. For example, if a decision would have been made differently, or may not have been made at all, without use of the computer program. An output will be “directly related” to a decision if it has a clear nexus to the decision. Anterior steps in the decision-making process may therefore fall within scope of APP 1.7 if they are “substantially and directly related” to the final decision. Entities should look at decision-making processes holistically, and consider the extent to which the outputs of a computer program meaningfully influence its decisions.
Whethera decision significantly affects an individual’s rights or interests should be assessed objectively. The OAIC provides a non-exhaustive list of potentially significant rights and interests, including access to employment, housing, education, health services, insurance, credit, government benefits and “significant goods or services“, such as baby formula, gluten-free foods, pharmacy items and medications. The examples suggest that significance should be assessed with reference to the decision’s objective impact on affected individuals and, in the case of significant goods and services, necessity. However, an individual’s circumstances, including any vulnerability they may be experiencing, should also be considered when assessing whether a decision disproportionately affects them over others.
Commercial-in-confidenceinformation remains protected. Trade secrets and commercially sensitive information do not need to be disclosed under APP 1.7 if doing so could harm the entity’s commercial interests (for example, by removing an opportunity for revenue or reducing competitive advantage in the market). However, information is not exempt from disclosure simply because it has some commercial value, nor where it could cause ridicule, criticism or embarrassment.
The level of detail disclosed must be meaningful to a reasonable person. The OAIC does not expect granular technical explanations of how the computer programs work that would overwhelm consumers. It is appropriate to aggregate the categories of decisions and types of information in the policy whilst still complying with the transparency obligation, provided that a reasonable person can understand how their personal information is being handled in the process.
Information may be needed from suppliers. APP 1.7(a) requires disclosure of ADM that an entity “arranges for” (even if the entity does not use the computer program in question itself). The OAIC recommends that, in order to assist customers with the disclosure requirement, vendors of relevant third-party software or enterprise solutions provide clear, high-level information about how their software can be used to make decisions. However as this is guidance only (and not a firm legal obligation) it remains to be seen if vendors will comply.
Examples of ADM use cases where the OAIC considers that disclosure may be required include:
use of facial recognition technology in a retail store or stadium for watchlist matching;
recruitment software used to sort through candidate profiles and make hiring decisions;
differential and/or personalised pricing practices used by online retailers in the sale of significant goods;
computer programs used to approve or reject a loan or credit application;
targeted advertising relating to the decision to sell significant goods or services; and
reports created by AI used to rank employee performance and determine promotions, or decide bonus/remuneration outcomes.
Importantly, the OAIC has emphasised that the disclosure obligations are not onerous. If in doubt, entities should err on the side of transparency and adopt an inclusive approach when updating their privacy policies. The assessment underpinning the decision to disclose (or not) is the key exercise that the OAIC wants businesses to undertake.
Rather than treating particular technologies, decisions or activities as automatically within or outside scope, businesses operating in Australia should use the OAIC’s guidance to identify where ADM is being used in their operations, and determine whether each use case meets the threshold for disclosure. The way that businesses use software, tools and other computer programs can also change over time, and so any decisions on the applicability of APPs 1.7 – 1.9 should be reviewed on a regular basis.
The UK GDPR establishes a robust framework for the protection of personal data, requiring organisations to give due regard to individuals’ data protection rights. Importantly, it recognises that the consequences of a data breach may extend beyond financial loss. Article 82 UK GDPR, supplemented by section 168 of the Data Protection Act 2018, provides a right to compensation for both material and non-material damage, including harm such as distress, anxiety and reputational damage. The threshold for proving damage arising from any breach of the UK GDPR has, to date, received greater judicial analysis in England than in Scotland.
Two recent Scottish decisions, the latter published last week, provide reassurance for controllers by reaffirming that, consistent withLloyd v Google, a mere data protection infringement does not entitle a claimant to compensation.
In Prentice v Chief Constable of Police Scotland [2025] SC LAN 32, the sheriff dismissed a claim for compensation under section 169 of the Data Protection Act 2018, finding that while the claimant averred distress, stress, anxiety and frustration, no details were provided as to how or when those effects manifested. Claims for financial loss arising from legal expenses, as well as an alleged disadvantage, were also dismissed due to a lack of sufficient specification.
In Henderson v The Scottish Ministers [2026] SC GLA 104, published last week, the sheriff also rejected a claim for damages arising from an admitted data breach, holding that evidence of psychiatric injury and distress was found to be neither credible nor reliable, and self-reported symptoms were unsupported by the contemporaneous medical records. The expert psychiatric diagnosis, founded entirely on the pursuer’s own account taken at face value, was given no weight.
The decisions reinforce that, whilst there is no formal threshold of seriousness, the onus of proving real, causally connected damage remains firmly on the claimant. Self-reported distress unsupported by independent evidence will not suffice.
While these cases concern individual claims, they sit within a broader landscape of expanding collective redress activity in Scotland. The emergence of certified group proceedings arising from data incidents – with three such proceedings underway to date – underscores the increasing use of Scotland’s group litigation framework for data protection claims.
The damage threshold principles confirmed in Prentice and Henderson carry particular significance in this context. Opt-out class proceedings face an inherent structural challenge in demonstrating individualised, causally connected harm across a large and diverse class. Where courts require more than bare assertions of distress, the task of establishing compensable damage at scale becomes materially more difficult for representative parties to discharge.
For Controllers, the message from these two decisions is one of cautious reassurance. Scottish courts will hold claimants, whether proceeding individually or as part of a class, to the evidential standard that the law demands. A breach alone opens no door to an award. That said, the volume of certified class proceedings is a reminder that robust data governance remains not just best practice, but the surest defence.
On 7 and 8 October 2026, the Supreme Court will consider the issue of whether a threshold of seriousness applies to claims for damages under the GDPR and Data Protection Act 2018 in Paymaster (1836) Limited v Farley and others – which will provide authoritative clarity to these issues.
Someone asks ChatGPT to compare web analytics platforms. They read the answer, close the chat and come back a day later by searching for one of the vendors by name. After reading a few pages, they book a demo.
Web analytics can capture the organic search visit, the pages viewed and the conversion. What it can’t show is whether an AI assistant influenced the decision before the visitor ever reached the site. That missing context creates an AI visibility gap: part of AI’s influence never becomes visible in the analytics data.
Here, visibility refers to measurement visibility, not how often a brand appears in AI-generated answers.
In Matomo’s Future of Web Analytics report, based on a survey of 300 web analytics experts in the United States, Germany and France, 92.7% say traffic from AI platforms such as ChatGPT and Perplexity is important to their business. Another 85.7% say AI-generated traffic has a strong or moderate impact on analytics data.
Visibility is uneven. 53.7% report clear visibility into AI traffic, while 40.7% say their visibility is partial. AI is also changing how teams approach measurement: 42.7% say it is forcing them to rethink how they measure performance, and 41% say it is increasing uncertainty in their data.
What the AI visibility gap means for analytics
AI search tracking covers identifiable visits from AI assistants. AI traffic attribution looks at how those recorded AI touchpoints contributed to a conversion.
The AI visibility gap begins where that evidence stops. If someone researches a product in ChatGPT and later arrives through organic search or Direct, analytics can measure the visit and the conversion. It can’t connect the earlier AI interaction to that person unless another measurable signal links the two.
That distinction affects how channel performance should be interpreted. An organic search visit is still an organic search visit, and Direct traffic shouldn’t be reclassified as AI simply because AI may have influenced an earlier stage of the journey.
Other sources can add context. CRM data can show whether a lead became revenue. Branded search trends can show changes in demand. Customer surveys can capture how people remember discovering a brand. AI citation monitoring tools can show where a brand appears in AI-generated answers. Each source contributes a different piece of evidence, and none should be treated as proof of an interaction it did not actually record.
Use each source for what it actually records, and don’t treat supporting data as proof of an AI interaction that wasn’t measured.
AI search tracking captures the visible part
When someone clicks a source link from an AI assistant and referrer information is available, analytics can identify the visit. Teams can then compare AI-referred visits with other acquisition channels and analyse landing pages, visit behaviour, goal conversions and other on-site outcomes.
An AI-influenced conversion may still belong to another channel
Traffic source and AI influence aren’t always the same thing. Consider three common journeys:
A person compares vendors in ChatGPT, later searches for one brand and converts through organic search.
A person sees a recommendation in Perplexity, returns later by typing the domain and converts during a Direct visit.
A person discovers a product through an AI assistant, then clicks a paid campaign while continuing their research and eventually converts.
In each case, the visible acquisition channel describes the visit that actually reached the website. Reclassifying organic search, Direct or paid traffic as AI without evidence would create false precision and make the channel report less reliable.
The same limit applies to attribution models. Multi-touch attribution can distribute credit across touchpoints that were recorded, but it can’t create a touchpoint that was never observed.
More AI referrals improve visibility into measurable visits. They still don’t explain AI influence that happened off-site, so teams need to separate recorded evidence from supporting context and inference.
What the data can and can’t tell you
A practical way to work with the gap is to look at each journey in layers. Start with what web analytics actually recorded, then add other evidence without presenting it as direct attribution.
Journey
What web analytics can see
What remains unknown
Other context
AI referral, then conversion
AI referrer, landing page, on-site behaviour and conversion.
Any earlier research or AI exposure before the click.
CRM data can add pipeline or revenue after the conversion.
AI research, then branded search and conversion
Organic visit, on-site behaviour and conversion.
Whether AI caused or influenced the organic search.
Self-reported discovery, search demand, CRM and AI citation monitoring can add context.
AI answer, no website visit
No on-site signal from that interaction.
The whole AI interaction and whether it influenced a later decision.
AI citation monitoring can show that the brand or page appeared in AI-generated answers, while brand-search trends can add further context. Neither provides direct attribution.
AI referral, then lead and closed deal in a multi-step enterprise sales process
AI referral and the on-site lead conversion.
The commercial outcome after the lead leaves the website.
CRM opportunity and revenue data connect the measurable visit to downstream value.
The final column helps you interpret the signals you already have. You probably won’t be able to reconstruct every journey end to end. Comparing data across systems can still show whether different parts of the journey support the same interpretation, without turning that context into a measured touchpoint. Self-reported discovery data can help too, with the limitation that it reflects what people remember and choose to report.
AI attribution needs context from more than one system
Different systems record different parts of the customer journey. Web analytics shows what happened on the website, while CRM data shows what happened to a lead or account afterwards. Search and campaign tools can show changes in demand and acquisition. AI citation monitoring can show whether, for example, a product page appears in ChatGPT or Perplexity responses. On its own, though, it doesn’t tell you whether those appearances led to a website visit or conversion. Web analytics provides the separate on-site view of identifiable visits and conversions. BI or a data warehouse can then bring several of those signals together under shared definitions.
The Future of Web Analytics report found that 49% of respondents expect hybrid approaches combining multiple systems to define the future of web analytics. Another 38% see foundational data layers connected to BI tools as part of that future, while 41% select integration with existing tools as a buying factor.
To connect AI-referred visits with pipeline or revenue, teams need a way to use analytics data alongside CRM, BI or other business data. Analysts also need ways to retrieve the data without being confined to one dashboard.
APIs and structured exports are established routes for that work. As AI becomes part of analysis itself, protocols such as MCP provide another option for compatible AI applications to retrieve analytics context. Matomo’s MCP Server, for example, can connect authorised tools such as ChatGPT, Claude and Codex to Matomo data. If the AI application is also connected to other systems, it can use Matomo data alongside that context without teams having to assemble everything manually first.
What to look for in an analytics setup
When assessing an analytics setup for AI attribution, look at whether it can support the following:
What to check
Why this matters
Can you identify human visits referred by recognised AI assistants and analyse their conversions separately?
This lets you compare AI-referred visits with other acquisition sources and see how those visitors behave and convert once they reach the website.
Can you separate automated AI agent or chatbot activity from human behaviour where the available signals allow it?
Automated activity can affect traffic and engagement figures. Keeping it separate makes human behaviour easier to interpret and allows AI optimisation as well.
Can analysts retrieve data through APIs or structured exports?
APIs and structured exports let teams use analytics data alongside CRM, BI or other datasets to analyse performance beyond the dashboard.
Can ecommerce teams compare AI-referred visitors with other human visitors across the on-site conversion funnel, while keeping automated AI activity separate?
This shows whether people arriving from AI tools behave differently across product, cart and checkout steps, without automated requests distorting conversion rates or drop-off analysis.
Can analytics data move into CRM, BI, warehouse and reporting workflows?
Conversion data becomes more useful when teams can connect on-site behaviour with leads, pipeline, revenue and other business outcomes.
Can authorised AI tools work with analytics data under clear access controls?
This keeps AI-assisted analysis within the access boundaries set for the underlying analytics data.
Can teams assess the quality of the underlying data, and is it unsampled and auditable?
AI tools work from the data they receive. Teams need to understand its limitations and trace how the numbers were collected and reported.
Can the team trace how sources are classified and how attribution logic is applied?
When a channel suddenly gains or loses conversions, analysts need to understand whether the change came from visitor behaviour, source classification or reporting logic.
These checks show whether teams can trace AI-referred visits, understand how they were classified and connect them with downstream business outcomes.
How Matomo helps with the measurable part
Matomo separates human visits referred by AI assistants from automated AI activity, so teams can analyse each on its own terms. The AI Assistant acquisition channel identifies human visits from recognised AI assistants when referrer information is available. Those visits can be compared with other acquisition channels and analysed across landing pages, behaviour, goal conversions and other on-site outcomes.
Dedicated AI reports cover activity that doesn’t represent a human referral. The AI Agent Overview compares recognised agent visits with human traffic, while AI Chatbots reports show how supported chatbots retrieve website content through server-side tracking. Content Requests reports can also show which pages and documents chatbots request, including content they favour or fail to retrieve. AI Chatbot requests themselves are processed separately from visits, so they don’t create visit or attribution data.
Teams can also work with Matomo data through AI-assisted workflows. The Matomo MCP Server gives authorised tools such as ChatGPT, Claude and Codex structured access to Matomo analytics data, so analysts can query it in natural language. If the AI application is also connected to other systems, it can use Matomo data alongside that context.
Ask Matomo, scheduled for the second half of October 2026, will bring that type of natural-language analysis into Matomo itself. Signed-in users will be able to ask questions about supported reports, analytics data and configuration, subject to their existing permissions.
Build AI attribution around the evidence you have
AI can influence research before a visitor reaches your website, but attribution still needs to follow the touchpoints you actually record.
If a recognised AI referral is recorded, you can analyse the visit and include that touchpoint in attribution. If someone arrives through organic search and there’s no measurable AI touchpoint, keep the visit under organic search. Customer surveys and AI citation monitoring can add context about earlier discovery, while CRM data can connect the recorded visit or conversion with downstream outcomes. None of those sources turns an unrecorded AI interaction into a measured touchpoint.
Use directly measured interactions for attribution and bring in other data where it adds useful context. When a connection is inferred rather than recorded, make that clear.
Une fuite ou un vol de données peut causer un préjudice pour les personnes concernées. Si l’incident résulte d’un manquement au RGPD, elles peuvent, sous certaines conditions, demander une indemnisation. C’est au juge, et non à la CNIL, de l’accorder.
La Commission nationale de l'informatique et des libertés s’est réunie le jeudi 1er octobre 2026 à 9 h 30 avec l’ordre du jour suivant :
À l’occasion du Mois européen de la cybersécurité, Cybermois en France, la CNIL et Cybermalveillance.gouv.fr s’associent autour d’un nouveau support pratique pour aider les particuliers à réagir en cas de violation de données personnelles et à adopter les bons réflexes pour limiter les risques.
On 17 September 2026, the European Commission unveiled its proposal for the EU KIDS Act (EU Keeping Internet Digital Spaces Accountable and Trustworthy), a harmonised EU framework designed to reshape how children engage with online services. The proposal goes well beyond age verification requirements and seeks to fundamentally change the design of digital services used by minors, placing greater responsibility on technology providers to create age-appropriate digital environments. It builds on existing legislation such as the EU Digital Services Act (DSA) and the EU AI Act but introduces more specific rules focused on child safety.
Which Services Are Covered?
The KIDS Act imposes extensive obligations on a broad range of online services. Its scope extends beyond social media platforms to encompass a wide range of online services, including:
online social networking services;
video-sharing platform services;
app stores;
online games;
operating systems;
AI companions; and
general conversational chatbots.
Summary of key requirements
The proposal is built around four core themes:
EU-wide minimum age for social media accounts
A key feature of the proposal is the establishment of common age-based rules governing children’s access to social media and certain video-sharing platforms across the EU. The Commission’s objective is to introduce a gradual and age-appropriate pathway into the online environment, reflecting growing concerns about the impact that social media and algorithm-driven content can have on children’s wellbeing and development. The Commission emphasises the need for a harmonised framework to avoid a fragmented landscape of national age thresholds and access requirements.
Under the proposal:
Children under 13 will be prohibited from accessing social media services. They would, however, be able to access specially designed child-friendly video-sharing services through an account managed by a parent or guardian.
Children aged 13 and 14 will only be able access social media and certain video-sharing services through parent-managed “mini accounts”. These accounts would offer limited functionality, enhanced parental controls and restrictions on use, including a daily screen-time limit.
From age 15, minors will be permitted to open and manage their own social media accounts and access covered video-sharing services independently.
In addition, under the proposal, providers would be required to determine whether existing account holders are under the age of 15. Accounts belonging to users identified as under 15, or whose age cannot be verified, would need to be disabled. Providers designated as Very Large Online Platforms (VLOPs) under the DSA would face additional obligations, including submitting a compliance plan demonstrating, through robust technical and evidentiary measures, a “high degree of confidence” that users have reached the age of 15.
Safety-by-design obligations
While the age-based access rules have attracted the greatest public attention, the KIDS Act’s broader ambition is to address the design choices that can encourage excessive use, amplify harmful content, or expose minors to inappropriate interactions. In doing so, it reflects a growing regulatory view that children’s online safety cannot be achieved through parental controls and age verification alone, but must be embedded into the architecture of the services themselves.
To achieve this, the proposed KIDS Act requires a wide range of online services used by minors, including social media platforms, video-sharing platforms, online games, AI companions and chatbots, to implement extensive safety-by-design measures. These include:
Restrictions on addictive features such as infinite scrolling, autoplay functionality, reward mechanisms and engagement-driven notifications, particularly during sleeping hours.
Safer recommender systems that provide minors with greater control over how content is suggested and reduce the risk of being drawn into harmful “rabbit holes” through profiling-based recommendation algorithms.
Privacy-protective default settings, including private accounts by default and limits on the collection and use of children’s personal data.
Strong protections against unwanted contact from strangers, cyberbullying and other forms of harmful interactions.
Child-friendly reporting, blocking and support tools that are easy for young users to access and understand.
The proposal also introduces specific safeguards for AI companions and chatbots. This includes requiring AI companions to be disabled by default for minors and avoid design features and system behaviours that simulate interpersonal relations that are likely to create emotional dependencies, manipulate behaviour or otherwise exploit children’s vulnerabilities.
Age verification and parental controls
The proposal introduces specific age assurance obligations requiring providers to establish whether users are above or below relevant age thresholds and to ensure that children are provided with experiences, features and protections that are appropriate for their age. The proposal also introduces a framework for verifying parental responsibility where an adult seeks to create or manage an account on a child’s behalf.
The proposal acknowledges that effective age assurance must be balanced with users’ privacy and data protection rights. As a result, it emphasises that age verification and age estimation mechanisms should be designed in a privacy-preserving manner, minimising the collection and retention of personal data and avoiding the introduction of de facto identity verification for access to online services. The proposal requires age to be verified through certified solutions independent of the platforms, including a free EU age verification app. The proposal requires Member States to offer at least one free way to prove age, including for people without digital ID.
To strengthen the effectiveness of these safeguards, social media services and video-sharing platforms are required to verify users’ ages at the point of account creation.
Parents and guardians will also be given enhanced control tools, including screen-time management, contact supervision and account-setting controls.
The proposal goes beyond the GDPR’s specific rules on children’s consent. Its age assurance and age-appropriate design obligations are not limited to processing based on consent but may also affect services that rely on other legal bases, such as contractual necessity or legitimate interests.
Compliance, Oversight and Penalties
Primary responsibility for supervising the largest services would rest with the European Commission, building on the model established under the DSA. In-scope providers could face substantial penalties for non-compliance, including fines of up to 6% of their worldwide annual turnover and, in the most serious cases, temporary restrictions on the provision of services within the EU.
The proposal also introduces proactive compliance obligations, particularly for VLOPs. The KIDS Act shifts the burden from regulators to providers, requiring VLOPs to proactively demonstrate, through a Commission-facing compliance plan and independent audits at their own expense, that they can meet obligations before their services are made available to children. The KIDS Act also introduces a supervisory fee, capped at 0.03% of a provider’s worldwide annual net income, to fund oversight and enforcement activities. The fee would apply not only to in-scope VLOPs, but also to certain providers of AI companions, general conversational chatbots and video gaming platforms.
Timing
The EU KIDS Act must now pass through the EU legislative process before it can be adopted. Several aspects of the proposal are likely to attract significant debate, particularly the age assurance requirements and the proposed age threshold of 15. While the European Commission has called for the legislation to be prioritised, adoption is unlikely to be immediate. Once adopted, most of the Act’s obligations would begin to apply six months after coming into force, giving providers a relatively short window to implement what are likely to be substantial compliance changes.
What does this mean for organisations?
Although the proposal is primarily aimed at online platforms and digital services used by children, its implications are likely to be far-reaching. Organisations operating consumer-facing digital services will need to assess whether their services fall within the scope of the Act and, if so, whether existing product designs, recommendation systems, engagement features and age assurance mechanisms are compliant.
The proposal also reinforces a growing regulatory expectation that children’s safety should be embedded into product development from the outset. Businesses may therefore need to revisit governance structures, risk assessments, design processes and compliance programmes to ensure that child safety considerations are integrated across the product lifecycle.
Protection des droits des électeurs, ingérences étrangères… lundi 16 novembre 2026, à partir de 14 h, la CNIL vous invite à son événement dédié aux enjeux éthiques associés aux communications politiques et aux ingérences. Les inscriptions sont ouvertes.
Le 17 septembre 2026, le CEPD a adopté des lignes directrices sur le pouvoir des autorités de protection des données d’infliger des amendes administratives et la version finale de ses lignes directrices sur l'interaction entre le règlement sur les services numériques (DSA) et le RGPD.
There was a time when website traffic came from a handful of well-understood channels: organic search, paid ads, social media, and direct visits. But over the past few years, that picture has changed. AI-powered platforms like Google’s AI Mode, ChatGPT, Perplexity and Bing’s Copilot now act as an entirely new discovery layer. It’s one that most analytics tools weren’t built to handle.
Traffic sources have diverged, but they’re also starting to behave differently.
According to Conductor’s 2026 AEO/GEO Benchmarks Report, based on 2025 traffic data, referral traffic from AI platforms accounted for roughly 1% of website traffic across 10 major industries, with ChatGPT responsible for about 87% of AI referral traffic in the study. A separate Microsoft Clarity analysis of more than 1,200 publisher and news websites found that visitors referred by large language models converted to sign-ups at 1.66%, compared with 0.15% from search and 0.46% from social. The figures come from specific datasets, but they illustrate why even relatively small volumes of AI-referred traffic are worth measuring.
But how do you know which of your visitors actually comes from AI-driven channels if your attribution software can’t track it?
This article explains how to check website traffic and explores 10 tools to help you measure traffic across a broad range of channels.
Key takeaways
AI assistants like ChatGPT, Perplexity and Gemini have become a distinct source of referral traffic. Depending on the analytics setup and the referrer information available, these visits may otherwise appear under broader categories such as Referral or Direct.
A 2025 Microsoft Clarity study of more than 1,200 publisher and news websites found that LLM-referred visitors converted to sign-ups at 1.66%, more than 10 times the 0.15% rate recorded for search in that dataset. AI referral traffic may still be small, but its quality makes it worth tracking.
At the moment, no single tool gives you the full picture. First-party analytics platforms measure actual visits, while third-party SEO tools estimate competitor traffic. Both have trade-offs around accuracy, privacy and cost.
Among the tools covered here, Matomo provides dedicated reporting for AI Assistant referrals and separate reports for supported AI Agent and AI Chatbot activity, helping teams distinguish human referrals from automated AI activity.
Why check website traffic?
Monitoring website traffic is important for almost any organisation with an online presence, even if most sales or services happen offline. In the internet age, customers and prospects are far more likely to research a company online before making a purchase.
SOCi’s 2025 Consumer Behavior Index found that consumers increasingly move between multiple platforms when researching brands. AI-driven discovery adds another route alongside traditional search, social media and other referral sources.
People increasingly use tools such as ChatGPT, Gemini and Perplexity to research questions and discover websites. For many sites, that creates a growing source of referral traffic worth measuring separately.
Human referrals are only one part of the picture. AI systems can also access website content directly through agents or server-side chatbot requests. Standard browser-based analytics will not necessarily capture these automated interactions, so understanding them may require dedicated detection or server-side integrations.
Organisations need a reliable view of what is happening on their sites, including where visitors come from and how they behave once they arrive.
Indeed, website data enables companies to understand their target audiences better, measure the effectiveness of marketing efforts and channels, and identify areas of the website that need improvement.
Let’s dig into those ideas in a little more detail.
Benchmark site performance
Keeping regular tabs on traffic levels is a great way to track a website’s performance over time. It can help with planning for the future and identifying current problems.
For instance, rising traffic levels may mean expanding the business’s offering or investing in more inventory. On the flip side, lower traffic levels may suggest it’s time to revamp marketing strategies or investigate SEO issues.
Analyse user behaviour
Checking website traffic, user behaviour, and other metrics shows marketing managers how users interact with the website. These traffic stats can help answer questions like:
Which pages are users visiting?
Which CTAs are they clicking on?
Which page elements encourage users to take the desired actions?
It can also identify issues contributing to high bounce rates or declines in search rankings.
The better you understand user behaviour, the easier it is to give visitors what they want. For example, the data could reveal that users spend more time on landing pages than blogs. You can use these insights to optimise blog content and improve performance.
Improve the user experience
Once you understand user behaviour, it’s easier to make adjustments, update content and improve the overall user experience. This also allows companies to create more personalised customer experiences, which can lead to growth.
That could take the form of sweeping changes, such as rearranging a website’s navigation bar based on user behaviour. It could also be personalisation that uses analytics to transform sections or entire pages based on individual user behaviour.
Optimise digital marketing strategies
Knowing current traffic levels and how they trend over time helps teams set benchmarks and prioritise marketing efforts.
Monthly traffic reports can inform SEO efforts and benefit marketing attribution. For example, they could indicate when it’s time to double down on organic traffic or when the better strategy is to invest more in PPC advertising.
Increasing organic traffic levels from other countries can help businesses identify new marketing opportunities. If traffic levels from a neighbouring country or a growing market increase significantly, it could be time for a cross-border campaign.
Filter unwanted traffic
Some website traffic comes from bots and other unwanted sources. This can compromise the quality of website data and make it harder to draw useful insights. While it’s nearly impossible to get rid of this traffic completely, many analytics tools have features to filter it out of the stats.
Why check competitors’ website traffic
Websites are windows into businesses and their strategies. That’s why monitoring traffic and other metrics drawn from competitors is essential.
There’s a lot to learn from the competition, both good and bad. What competitors do well can be replicated, and learning from the elements they get wrong can help you avoid making the same mistakes.
Strategic planning: Looking at traffic on specific pages can offer insight into potential marketing campaigns and highlight gaps in the market that may be worth attacking. Looking at their organic, paid, social and referral traffic levels can highlight opportunities for growth or pinpoint the reasons for success in a particular area.
Benchmarking: Looking at website traffic in isolation can lack context. Monitoring other sites’ engagement metrics, such as bounce rate and average session duration, can give you an inside look at the competition and help you set realistic performance goals and benchmarks.
Product development: Significant traffic volume on certain pages can indicate shifts in demand and market trends, which may inform the development of new products or services. For example, if a competitive dog food supplier ranks well for the term “organic dog food”, that might be something to consider when formulating new products.
Audience demographics: Comparing competitors’ audiences can highlight opportunities and help a business narrow its target audience. This guides messaging and campaign strategies to capture specific audience segments.
Keyword opportunities: Examining the keywords driving the most traffic to a competitor’s website can help you uncover untapped SEO potential for your website. Analysing top-performing content on competing sites can help identify content improvement strategies to pull traffic away from competitors.
Partnerships: Referrals are an often-overlooked traffic metric. High volumes of such traffic indicate successful partnerships between competitors and third parties, which is a model worth emulating.
9 important website traffic metrics to track
Traffic metrics depend on the priorities and goals teams have. Also, metrics and their importance can fluctuate over time. That said, some evergreen metrics matter to most teams working with web analytics:
New visitors: Users who have never visited the website before. They are a great sign that marketing efforts are working and the website is reaching more people. But it’s also important to track how they behave on the website to ensure the site caters effectively to the needs of new visitors.
Returning visitors: Returning visits can indicate sustained interest, repeat use or an ongoing customer relationship. Whether a higher return rate is desirable depends on the purpose of the site, so interpret this metric alongside conversions and other engagement signals.
Bounce rate: This measures how many users leave the website without taking action. Different analytics tools measure this metric differently.
Session duration: This is the time users spend on the website, which can reveal whether they find the site engaging. And when considered alongside the next metric, it can be especially insightful.
Pages per session: This measures the average number of pages a user visits on a website. The more pages they visit and the longer users spend on the website, the more engaging it is.
Traffic source: Traffic can come from various sources (organic, direct, social media, referral, etc.). Knowing the highest sources of referral traffic can help analyse and prioritise marketing efforts.
User demographics: This shows who visits a website, which devices they use, which countries they come from, etc. While most website traffic will come from the countries targeted by marketing, an influx of new users from other countries can open the door to new opportunities.
AI referral traffic: As AI assistants have become a new discovery channel, you’ll need to start tracking how much traffic comes from platforms like ChatGPT, Gemini and Perplexity. This metric shows whether AI-generated recommendations are driving visitors and which platforms are sending them.
AI chatbot activity: This metric is separate from human visits. Chatbot crawl traffic measures how often AI systems fetch content from a site. Metrics like chatbot requests, acquired visits (clicks from chatbot-generated links) and click-through rate help gauge how visible content is within AI-generated answers.
10 tools to check website traffic
There are many tools for checking website traffic, but they do not all measure the same thing. First-party analytics platforms collect data from your own site, while SEO and competitive-intelligence tools usually estimate traffic from external datasets. Understanding that distinction is essential when comparing their numbers.
Many first-party analytics tools use JavaScript or another tracking method on the website to collect data such as page views, visit duration and specific interactions. Depending on the product and configuration, they may also use cookies or other identifiers to recognise returning visitors.
Many tools offer advanced event-tracking functionality. This captures specific actions, like clicks or form submissions, and provides a more granular view of engagement. The data is then statistically analysed to identify trends and calculate key metrics, such as bounce and conversion rates.
Other tools use external datasets and modelling to estimate traffic, rankings or audience behaviour for sites you do not own. These estimates are useful for competitive research, but they are not equivalent to first-party analytics data.
This section explores 10 popular tools for checking website traffic and highlights their unique features and benefits.
1. Checking website traffic with Google Analytics
When teams first start looking into their website traffic, Google Analytics is often one of the first tools they consider. It’s free to use, incredibly popular and offers a wide range of traffic reports.
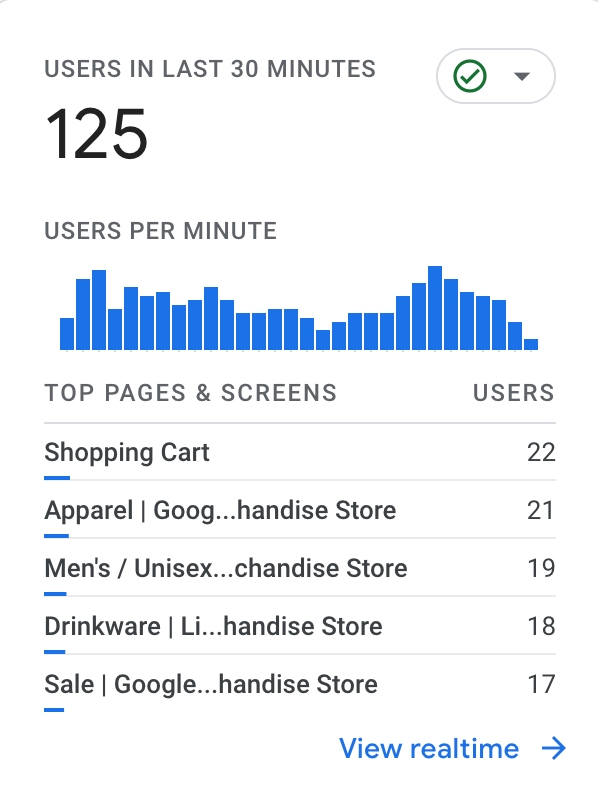
It breaks down historical traffic data in many different ways. It can split traffic by acquisition channel (organic, social media, direct, etc.), by country, device or demographic. It also provides real-time traffic reports that offer a snapshot of users on the site right now and over the last 30 minutes.
GA4’s Traffic acquisition report helps to understand where website and app visitors are coming from.Image source
Google Analytics is one of the most widely used ways to check website traffic, but its reporting is affected by consent choices and implementation. With Consent Mode, GA4 can send cookieless measurements when analytics storage is denied and, where eligibility requirements are met, use behavioural modelling to estimate some activity from visitors who decline Analytics cookies. That means teams should distinguish between directly observed data, cookieless measurements and modelled data when interpreting reports.
GA4 can also help to pinpoint the pages and screens that receive the most traffic. Image source
Sampling can also affect some GA4 analysis. In standard GA4 properties, Explorations may be sampled when a query includes more than 10 million events. Google also documents circumstances in which very large filtered datasets can trigger sampling in reports. Standard reporting is therefore not universally sampled, but advanced or high-volume analysis may use a subset of available events.
Sampling can make large datasets faster to query, but it also means the result is an estimate based on a subset of events. When a report is sampled, check GA4’s data quality indicator before drawing conclusions from small differences or anomalies.
For teams that need unsampled first-party reports, Matomo offers an alternative approach. The right comparison still depends on configuration, consent requirements and the type of analysis being performed, so avoid assuming that any analytics platform captures every visitor in every jurisdiction or setup.
GA4’s default channel groups do not currently include a dedicated AI referral channel. Visits from tools such as ChatGPT, Perplexity or Copilot may therefore appear under Referral when referrer information is available, or under another channel such as Direct when it is not.
Clicks from Google’s own AI search experiences are also difficult to separate in GA4 acquisition reporting because they are part of Google Search traffic rather than a dedicated AI channel. Google Search Console has started rolling out a separate Generative AI performance report for AI Overviews and AI Mode, but that report focuses on Google Search impressions rather than on-site behaviour.
You can build custom channel groups or filters to isolate known AI referral domains in GA4, but this requires manual setup and maintenance as platforms change. Like other referrer-based attribution, it also cannot identify a human AI referral when the source does not provide usable referrer information.
2. Checking website traffic with Matomo
Matomo is a privacy-focused, open-source web analytics platform that can be configured for cookieless tracking. In France, a Matomo configuration that meets the CNIL’s conditions for audience measurement can qualify for the authority’s consent exemption. Consent requirements still depend on the jurisdiction, configuration and data collected, so cookieless tracking should not be treated as universally consent-exempt.
Matomo records first-party website analytics without report sampling and provides several ways to inspect traffic in detail. These include:
Visits log report
Real-time visitor map
Visits in real-time report
Let’s look at all of them one by one.
The Visits Log provides a granular view of individual visits, rather than only aggregated traffic totals.
Matomo’s Visits Log Report provides a detailed breakdown of tracked visits.
You can access the Visits Log from Visitors > Visits Log. Depending on your configuration and available data, each visit can include information such as:
The location of the user
The total number of actions they took
The length of time on site
How they arrived at your site
The device they used to access your site
For high-traffic sites, the Visits Log is best used for focused investigation rather than aggregate analysis. It helps teams inspect individual visit sequences and understand what happened within a specific session.
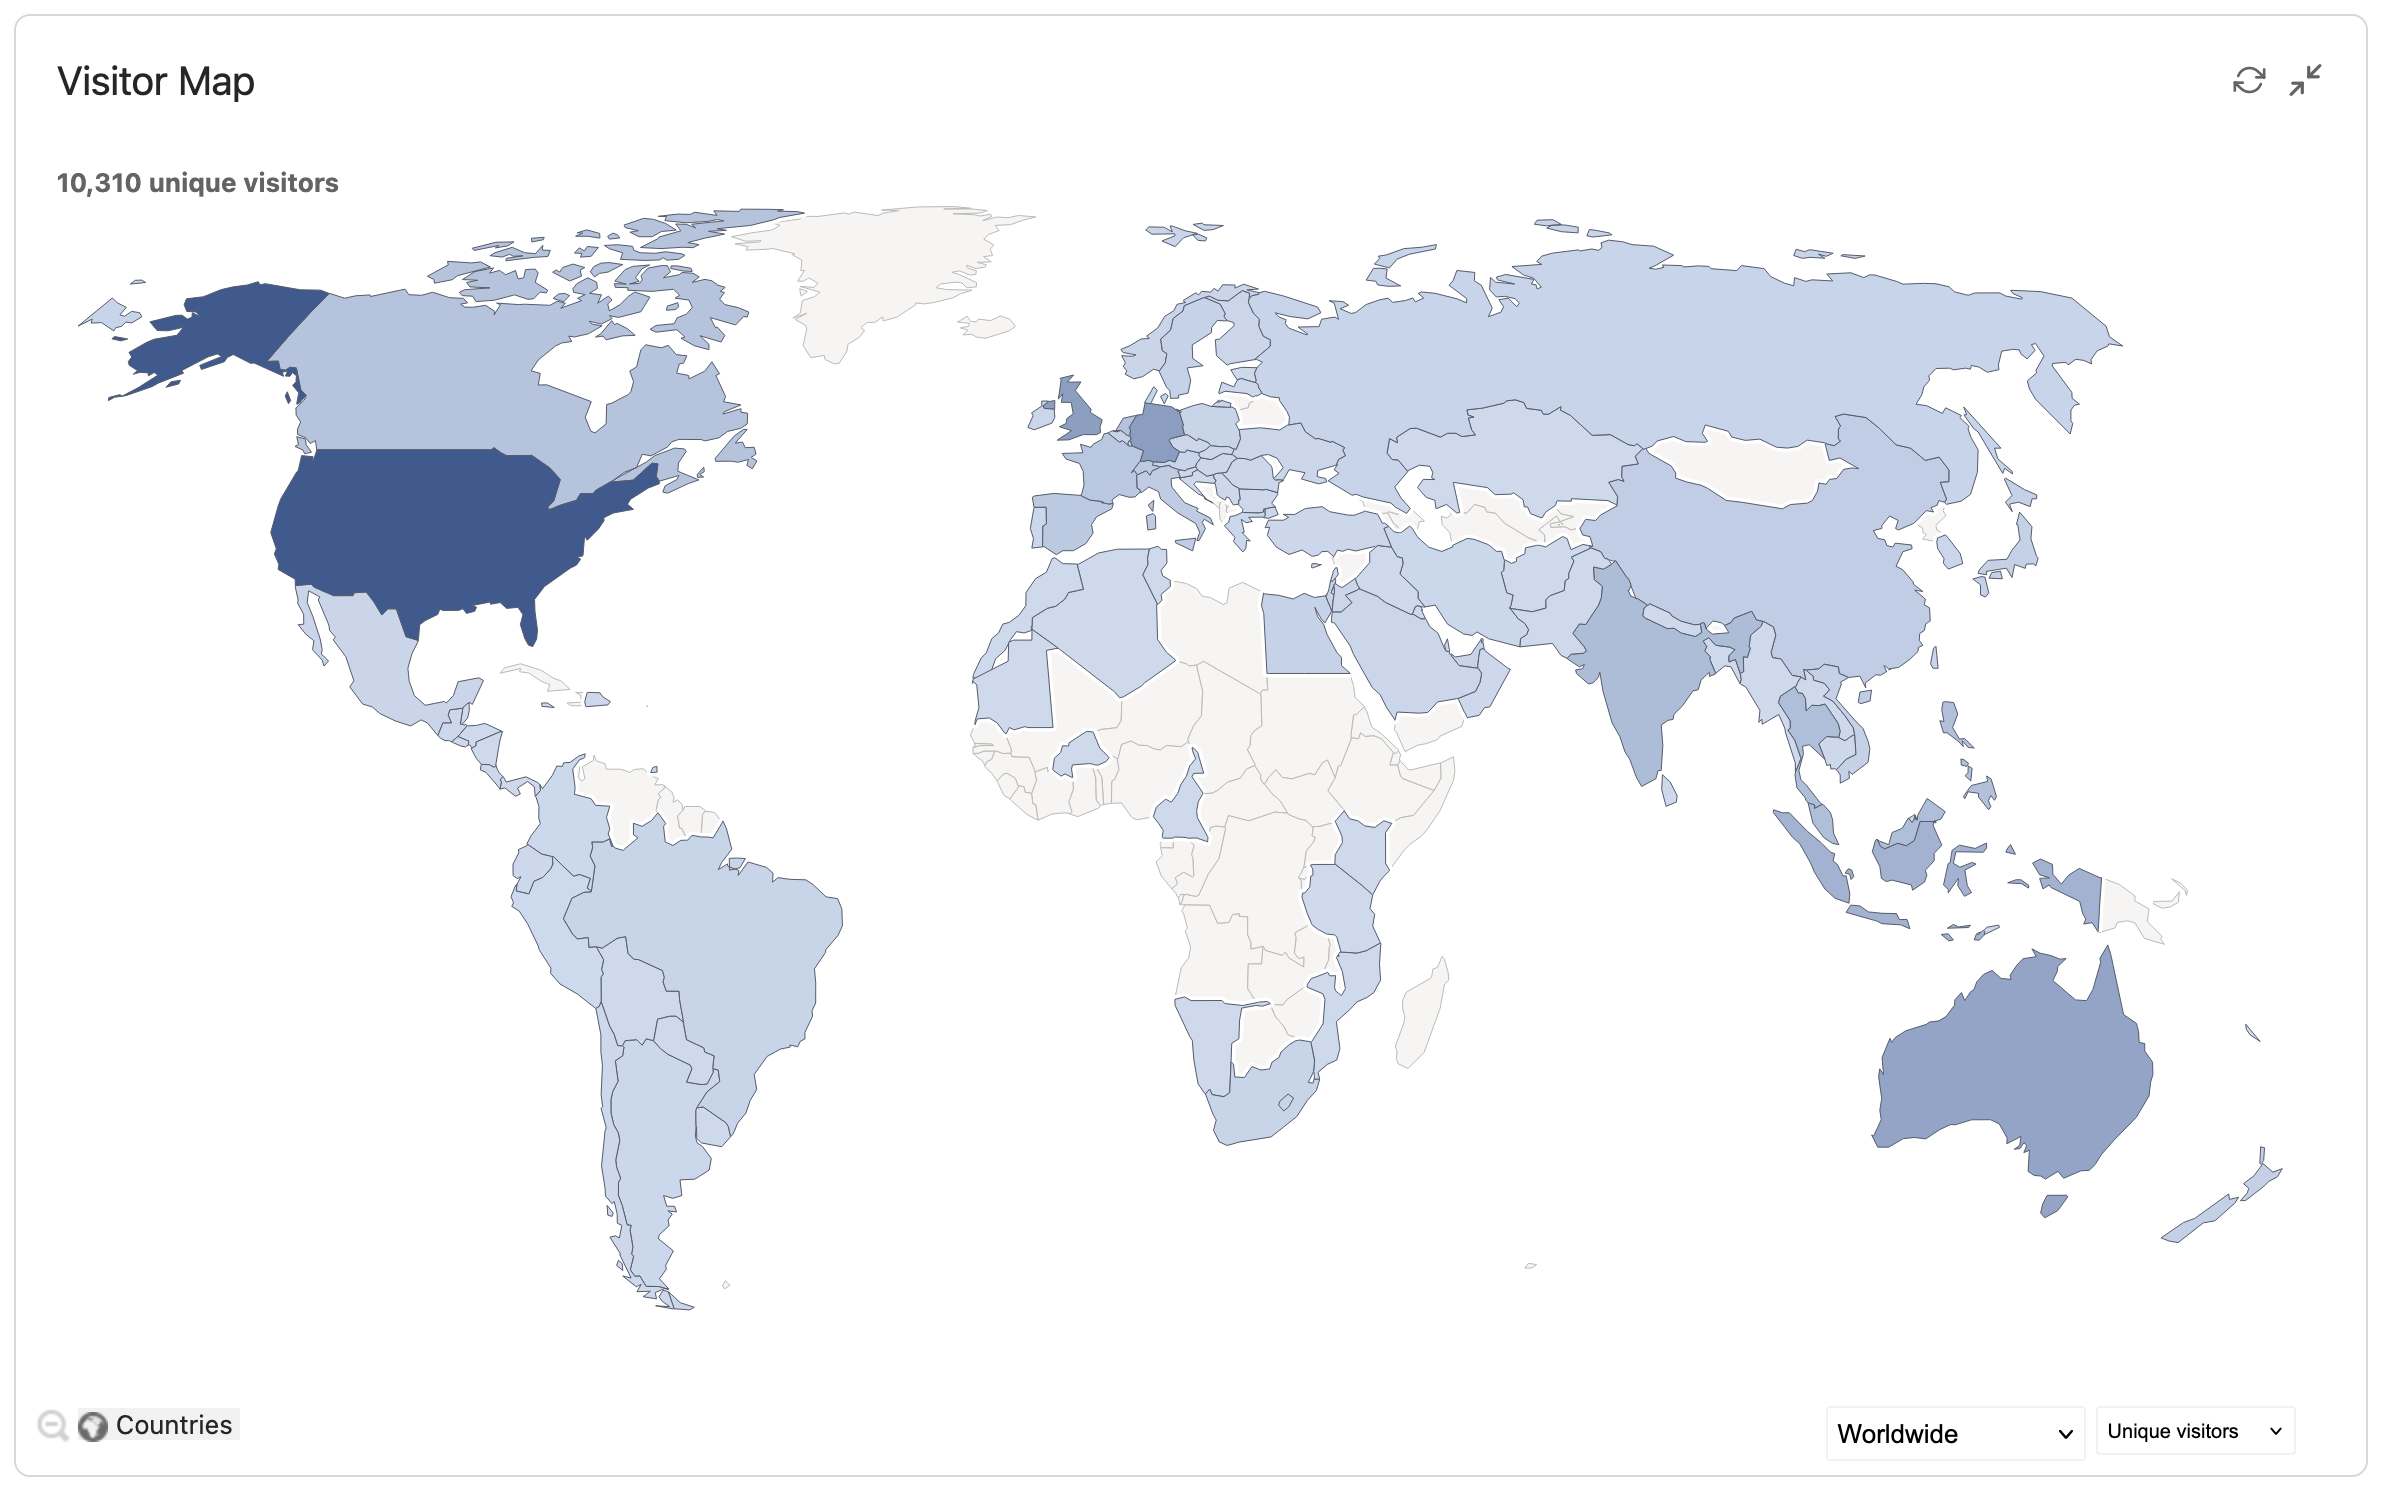
The Real-time visitor map shows the locations of site visitors over a given timeframe. If you have an international website, it’s a useful way to see the geographic distribution of tracked visits.
Matomo’s Geo-Location dashboard reveals where website visitors are located.
You can access the Real-time Visitor Map by clicking Visitor in the main navigation menu and then Real-time Map. The map itself is colour-coded. Larger orange bubbles represent recent visits, and smaller dark orange and grey bubbles represent older visits. The map will refresh every five seconds, and new users appear with a flashing effect.
If you run time-sensitive campaigns such as TV or radio advertising, the Real-time Map can help you see whether traffic changes immediately afterwards. Use campaign tracking and conversion data alongside the map before attributing a traffic increase to a specific advert.
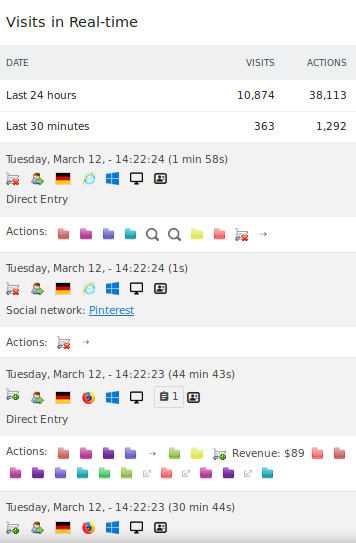
Finally, the Visits in Real-time report provides a snapshot of who is browsing your website. You can access this report under Visitors > Real-time and add it to your custom dashboards as a widget.
Open the report, and you’ll see the real-time flow of your site’s users and counters for visits and pageviews over the last 30 minutes and 24 hours. The report refreshes every 5 seconds, adding new users to the top with a fade-in effect.
Matomo’s Visits in Real-time report displays new visits or current visitors viewing a new page. Image source
The report provides a snapshot of each visitor, including:
Whether they are new or returning
Their country
Their browser
Their operating system
The number of actions they took
The time they spent on the site
The channel they came in from
Whether the visitor converted a goal
AI traffic tracking
One area where Matomo differs from the other tools covered here is its built-in AI traffic reporting. The AI Assistants acquisition channel is available in Matomo Cloud and from Matomo 5.5.0 On-Premise. The AI Agent reports are available from Matomo 5.6.0, while dedicated AI Chatbot reports were introduced in Matomo 5.8.0.
Matomo includes a dedicated AI Assistants channel type that classifies visits referred by recognised AI assistant domains when referrer information is available. Supported sources include:
ChatGPT
Bing Copilot
Gemini
Claude
Perplexity
Meta AI and others
You do not need to build a manual regex setup or maintain a custom channel group for recognised AI Assistant referrals. They appear alongside organic, social, referral and direct traffic in Matomo’s standard Acquisition reports. As with any referrer-based attribution, however, Matomo can only attribute an AI Assistant referral when usable referrer information is available.
The AI Chatbots Overview report covers server-side requests from supported AI chatbots that retrieve website content without executing the standard JavaScript tracker. Chatbot tracking requires a supported server-side integration, such as WordPress, Cloudflare, Amazon CloudFront or the HTTP Tracking API. Reports include metrics such as chatbot requests, acquired visits and click-through rate.
The AI Agent Overview report covers recognised autonomous AI systems that can interact with websites without continuous user input. Matomo can identify supported agents when they execute the Matomo tracker or send suitable tracking requests and identifying signals. The report compares AI Agent activity with human visits side by side.
You can also create a custom segment using the condition “Channel Type is AI” to analyse AI Assistant referral visits across other Matomo reports, including behaviour and conversion data.
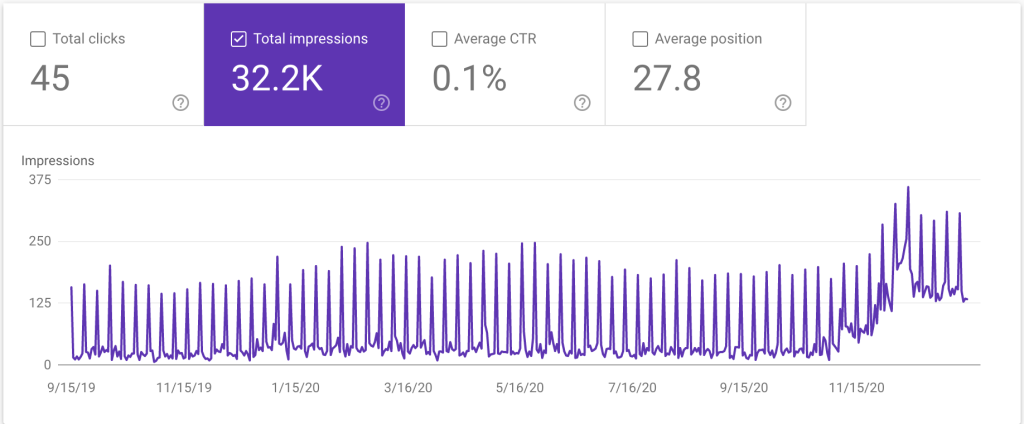
Google Search Console is a free tool that analyses a website’s Google search traffic. The top-line report shows how many times the website has appeared in Google Search, how many clicks it has received, the average click-through rate and its average position in the search results.
Google Search Console can reveal keyword patterns and spikes in interestImage source
It’s a great way to understand what the website ranks for and how much traffic organic rankings generate. It will also show which pages are indexed in Google and whether there are any crawling errors.
Unfortunately, Google Search Console is limited if a complete view of traffic is needed. While search traffic can be analysed in great detail, it will not report how users who access the website behave on the site.
Google Search Console still does not provide referral analytics for traffic arriving from external AI assistants such as ChatGPT or Perplexity because it measures performance within Google Search. However, Google has started rolling out a separate Generative AI performance report for eligible properties, showing impressions from AI Overviews and AI Mode.
The Generative AI performance report can show which pages receive impressions in Google’s generative AI features, as well as dimensions such as country, device and date. It does not replace first-party analytics: to understand what visitors do after clicking through, you still need an on-site analytics platform.
Access to Google’s Generative AI performance report is still rolling out, so not every Search Console property will see it yet.
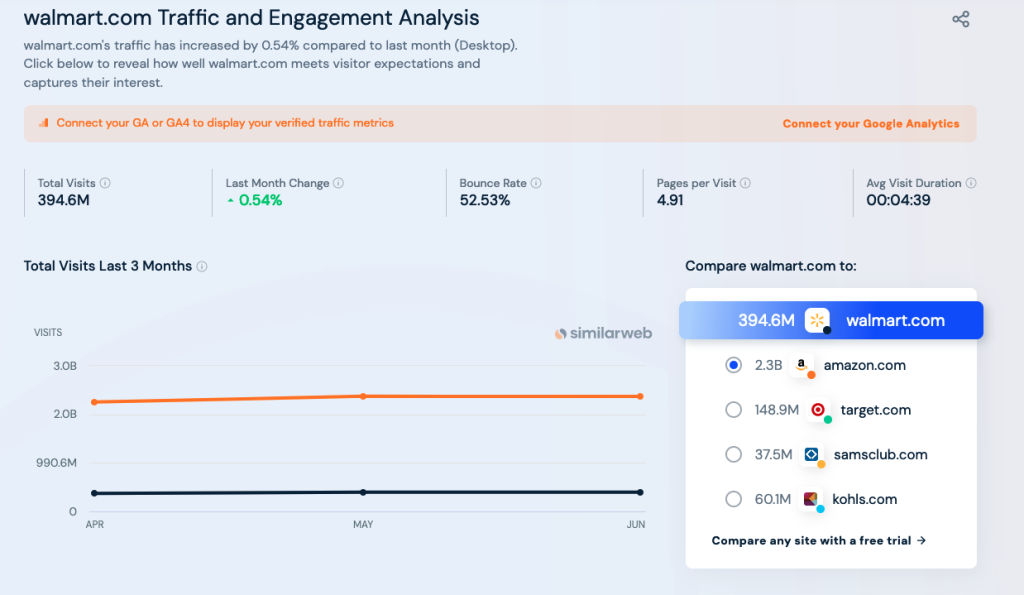
Similarweb is a website analysis tool that estimates the total traffic of any site on the internet. It is one of the best traffic checker tools for estimating how much web traffic competitors receive.
What’s great about Similarweb is that it estimates total traffic, not just search engine traffic, unlike many SEO tools. It even breaks traffic down by channel for easy comparison.
Similarweb’s dashboard shows how traffic levels increase or decrease month-over-month. Image source
Similarweb provides estimates of total visits, bounce rate, average number of pages viewed per visit, and average duration on the site. The company also has a free browser extension that continues checking website traffic estimates while the user is browsing the web.
Similarweb can also estimate AI-driven referral traffic at the domain level. That makes it one of the few competitive intelligence tools that shows you roughly how much traffic AI platforms send to any website. It’s useful for benchmarking against competitors, though you have to note that the figures remain estimates rather than precise counts.
Similarweb offers limited free access. Its Competitive Intelligence plan currently starts at $125 per month when billed annually, with separate products available for AI Search Intelligence. Pricing and packaging change, so check the current plan before buying.
The price isn’t the only downside for Similarweb. Ultimately, it provides reasonably accurate estimates but falls short of a comprehensive traffic analytics tool.
Semrush is a collection of marketing solutions for online businesses. Its Traffic Analytics tool analyses up to 100 websites and compares their traffic side by side. For each site, it reveals the top pages, the regions from which most of the traffic comes, and the locations from which the most referrals come.
Semrush also gathers insights into competitors’ audiences and their activity, especially activity that overlaps between the sites being checked. It extracts and analyses comprehensive data on organic and paid search, social media, and backlinks.
Semrush has also moved into AI traffic tracking with its AI Visibility Toolkit, which was launched in 2025. At the moment, the toolkit monitors how a brand appears in AI-generated results across ChatGPT, Google AI Overviews, AI Mode, Perplexity and Gemini.
It’s available as a dedicated add-on starting at $99 per month per domain, or bundled into Semrush One plans. One thing you should keep in mind is that this doesn’t track AI referral traffic to your site the way a web analytics platform does. Instead, it tells you how often AI platforms cite or recommend your brand. That’s a different question altogether, but a valuable one for teams thinking about AI-driven discoverability.
Semrush’s traffic analytics monitors traffic stats for competitor websites.Image source
Semrush’s SEO Classic toolkit currently starts at $139.95 per month, while its AI Visibility toolkit starts at $99 per month per domain. The overall cost can rise quickly when teams need multiple toolkits, domains or users, so compare the package against the specific data you need.
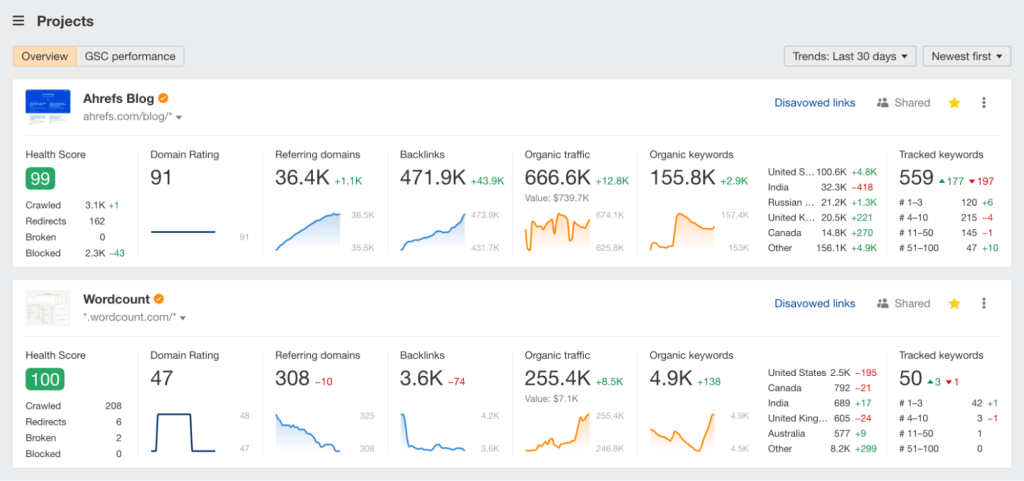
Ahrefs‘s biggest strength is its organic traffic estimation capabilities. It estimates monthly visits from Google worldwide, the Google keywords in the top 100 that a website ranks for, and traffic value via an equivalent to PPC.
Ahrefs’ SEO dashboard uses trend graphs to show how projects are performing. Image source
Ahrefs bases its estimates on ranking data from a database of roughly 28.7 billion keyword topics across global markets, which is why it is so powerful. It generates a detailed report that includes organic traffic estimates, backlink data, and top-performing keywords.
However, the numbers produced by Ahrefs are estimates based on available data and may not be 100% accurate. This is particularly true for smaller or newer websites that lack the data volumes needed for accuracy.
Ahrefs has also introduced Brand Radar, an AI visibility add-on that tracks how a brand is mentioned and represented across AI-generated responses. It’s priced at $199 per month per AI index (or approximately $699 per month for all six indexes), and it sits on top of a core Ahrefs subscription.
But as of May 2026, the company has introduced “prompt-only” packages where you can pay for a specific set of prompts and cross-check them against every available AI index. The packages for those start at $50 for 2,500 prompts per month.
Like Semrush’s toolkit, Brand Radar focuses on visibility within AI outputs rather than tracking inbound AI referral traffic directly.
Ahrefs offers limited free tools, while its paid plans add broader research and reporting capabilities. Current paid options include Starter at $29 per month and Lite at $129 per month, with higher-tier plans available for larger teams.
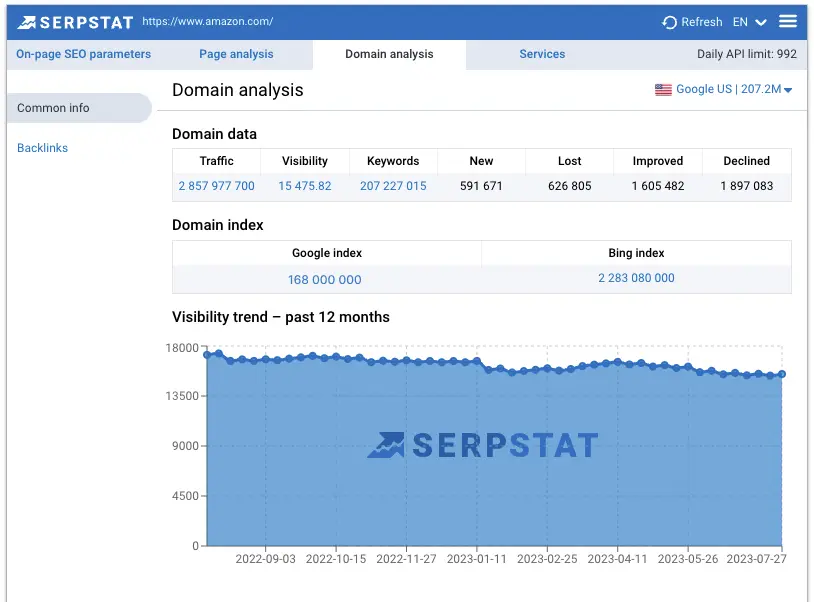
Serpstat is an SEO solution that grew from a simple keyword research tool. It offers more comprehensive features to help businesses understand their website’s performance. It helps improve a site’s visibility through tools for rank tracking, keyword research, traffic checking, backlink analysis, and site auditing.
Serpstat’s Domain Analytics dashboard shows trends over a 12-month period. Image source
It provides metrics like estimated monthly visits, traffic sources (organic, paid, and referral), and insights into top-performing pages. Serpstat also offers competitor analysis features that help to identify market trends and refine growth strategies. However, like Ahrefs, the numbers provided are estimates, which are only as good as the depth of data from which they are derived.
Serpstat’s current plans start with Individual at $50 per month, while Team starts at $100 per month and Agency at $410 per month on its published pricing page. The Team tier adds features including:
ChatGPT and Claude Integration (MCP)
AI Overview Brand Opportunities Report
Share Access
AI Tools
The platform doesn’t offer this in the lower-priced plans, so you have to spend more to access these features.
SEO PowerSuite also goes some distance beyond just website traffic checking. As the name implies, it’s a suite of tools to improve website rankings.
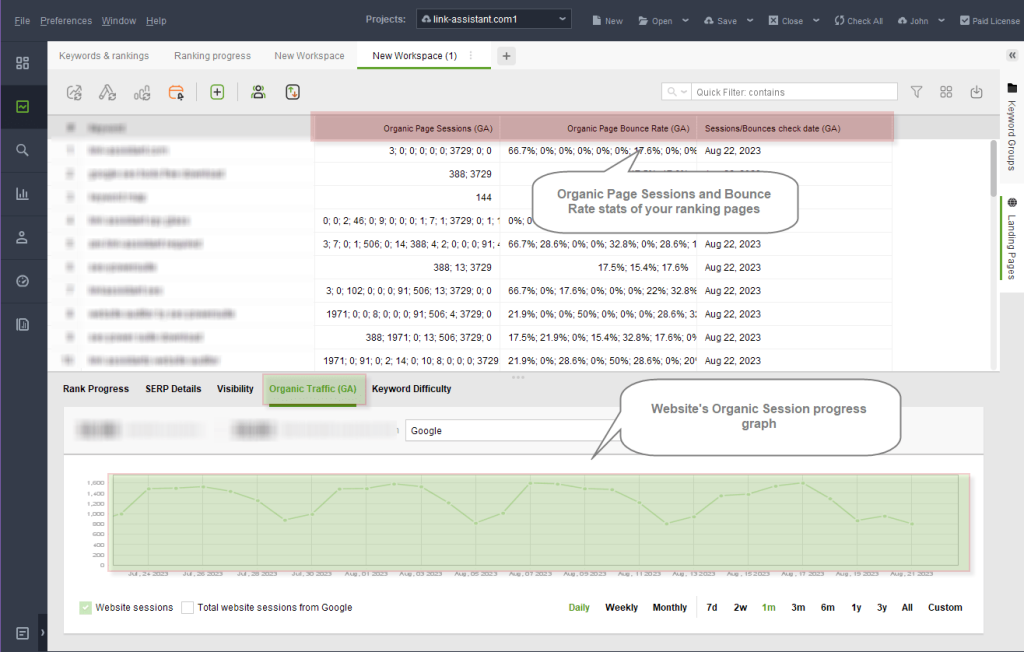
Rank Tracker’s SEO dashboard reveals organic session growth over time. Image source.
There are four tools in the suite:
Rank Tracker enables tracking a website’s search engine rankings across multiple keywords and search engines.
Website Auditor offers SEO analysis of website pages and recommends actions to boost performance.
SEO SpyGlass analyses a website’s backlink profile to highlight link-building possibilities that’d help improve performance.
LinkAssistant helps identify suitable websites for link building and recommends viable outreach opportunities.
SEO PowerSuite offers a free edition alongside paid licences. Check its current pricing and AI-search coverage before choosing a plan, as both product capabilities and packaging can change.
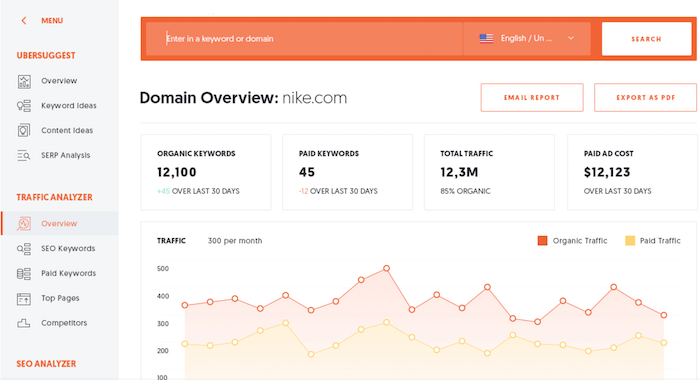
Ubersuggest is also an SEO-focused tool. It offers website traffic analysis, keyword rankings, backlink profiles, and competitor insights. These are packaged in reports that provide an overview of website traffic, including monthly organic traffic totals and the number of organic keywords the site ranks for. Ubersuggest also offers content suggestions.
Ubersuggest’s Domain Overview Dashboard provides an overview of a website’s traffic. Image source
Like other tools in this category, Ubersuggest doesn’t collect comprehensive data, so its numbers are estimates. This means the accuracy can vary. However, it remains a solid choice for providing great insights and enhancing a website’s online presence.
Ubersuggest also includes AI Search Visibility features for monitoring how a brand appears in AI-driven search experiences. This is visibility monitoring rather than first-party measurement of visits to your website.
This tool offers limited free access and paid plans with different project and usage limits. Because its pricing and AI-search allowances change over time, check the current plan details before subscribing.
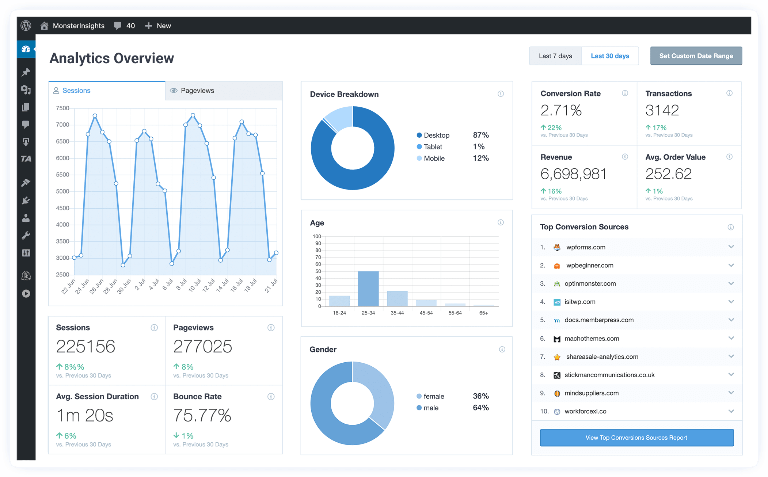
MonsterInsights is a tool worth considering for WordPress websites because it’s not a typical website-checking tool. It’s a WordPress plugin that simplifies the task by integrating Google Analytics directly into a website.
MonsterInsights then uses raw GA4 data to extract actionable insights into audience preferences and activity. This makes it easier to focus on the relevant metrics for different types of websites. For example, the metrics used to measure a blog site would differ from those for an ecommerce site.
But there are some downsides, too. While the basic version is free, advanced reports and integrations require a paid plan. Current promotional pricing starts at $99.50 per year for Plus and $199.50 for Pro, while the 25-site Elite Bundle is listed at $299.50 per year. Check the current pricing page before buying, as promotional rates can change.
MonsterInsights’ Analytics Overview offers a snapshot of a website’s traffic volumes. Image source
Why do my traffic reports differ?
If you use more than one of the methods above to check your website traffic, you’ll quickly realise that every traffic report differs. In some cases, the reasons are obvious. Any tool that estimates your traffic without adding code to your website is just that: an estimate. Tools like many of those mentioned here will never offer the accuracy of analytics platforms like Matomo and Google Analytics.
Each platform records and processes activity differently. Consent settings, tracking methods, attribution rules, bot filtering, time zones, identity resolution and sampling or modelling can all change the numbers you see.
Consent is one source of discrepancy. With GA4 Consent Mode, denied analytics storage can still result in cookieless measurements, and eligible properties can use behavioural modelling to estimate some activity from visitors who do not consent to Analytics cookies. Those modelled or cookieless measurements are not the same as fully observed, cookie-based visitor data.
Matomo can be configured to track without cookies, which can support privacy-conscious measurement and, in some jurisdictions and configurations, consent-exempt audience measurement. But consent requirements vary by country and setup. For example, Matomo’s own guidance notes stricter ePrivacy requirements in jurisdictions such as Germany and the UK, while France’s CNIL exemption applies only when specific conditions are met. Differences between Matomo and GA4 should therefore be interpreted in the context of each implementation rather than as a universal traffic uplift.
Consent choices can materially affect the amount and type of directly observed analytics data available, especially where a setup depends on non-essential cookies or identifiers.
A 2024 analysis of more than 1.2 million cookie-banner interactions found that 25.4% of visitors clicked ‘Accept all’, while many others rejected, closed or ignored the banner. The precise impact on analytics depends on the consent implementation and measurement method, but the study illustrates why consent behaviour can materially affect observed data.
AI traffic attribution adds another layer of discrepancy. Different analytics platforms classify AI referrals differently. In GA4, visits from recognised external AI tools can appear under broader channels such as Referral, while visits without usable referrer information may appear elsewhere. Google’s AI Overviews and AI Mode are part of Google Search rather than a dedicated AI acquisition channel in GA4.
Matomo gives recognised AI Assistant referrals their own acquisition channel when referrer information is available. The same visit may therefore be categorised differently across analytics products, which is one reason cross-platform traffic totals and channel reports rarely match exactly.
If you rely on web analytics for important decisions, understand how your chosen platform collects, models and categorises data, and validate material discrepancies before acting on them.
What to do if website traffic levels drop
Experiencing a drop in website traffic can be frustrating, but it happens to everyone at some point. Here’s how to address it:
Analyse traffic sources: Use analytics tools to pinpoint the source of the decline, like organic search, referrals, or social media.
Check for technical issues: Look for broken links or slow loading times, which can deter visitors. Tools like Google Search Console can help identify errors.
Review recent changes: Consider any recent updates to the website. If something coincided with the drop, it might be worth reverting.
Evaluate content quality: Ensure the content is engaging and relevant. Update or improve underperforming posts.
Check AI-driven discovery patterns: AI platforms can surface your content without always generating a click. Review AI Assistant referrals, AI visibility data and, where available, Google Search Console’s Generative AI performance report to understand whether discovery is shifting towards AI-generated results.
Reassess the marketing strategy: Revisit the balance between paid ads, social media and other channels to evaluate their effectiveness and adjust the approach.
Website traffic naturally fluctuates, but sustained declines deserve investigation. Use the available data to identify which source, page group or audience changed before deciding how to respond.
Get more accurate traffic reports with Matomo
There are several ways to check website traffic. Competitive-intelligence tools estimate traffic to sites you do not own, while first-party analytics platforms measure activity on your own site. Matomo provides unsampled first-party reporting, flexible privacy controls and dedicated AI reporting that distinguishes AI Assistant referrals from supported AI Agent and AI Chatbot activity.
Join organisations around the world using Matomo to understand website traffic while retaining control over their analytics data. Start your 21-day free trial — no credit card required.
FAQs
How do I know who visited my website?
Many web analytics tools use JavaScript or another tracking method to record visits and interactions. Depending on the setup and data available, this can include device and browser information, approximate location, referral source and actions taken. Matomo’s Visits Log lets you inspect individual visits in detail, including how a visitor arrived and which tracked actions occurred during the visit.
Which traffic checker is most reliable?
For a site you own, first-party analytics platforms such as Matomo and Google Analytics are generally more suitable than competitor-estimation tools because they measure activity on the site directly. Matomo provides unsampled reports and can be configured for cookieless tracking, but the completeness of any analytics dataset still depends on consent requirements, implementation, blockers and other technical factors.
How do I check my website traffic for free?
For your own website, Google Analytics offers free first-party analytics, while tools such as Ahrefs provide limited free SEO and traffic-estimation features. Matomo Cloud offers a 21-day free trial, and Matomo On-Premise is available as open-source software for teams that want to host it themselves.
Is it legal to check website traffic?
It is generally legal to measure traffic on a website you operate, but how you collect and process visitor data must comply with the laws that apply to your organisation and audience. In the EU, this can include the GDPR and national ePrivacy rules; in the UK, the UK GDPR and PECR are relevant. Consent requirements depend on the technologies, purposes and data involved, so do not assume that every analytics configuration has the same legal basis.
Can competitors see my website traffic?
Your competitors can’t see your exact traffic data unless they have direct access to your analytics account. However, third-party tools like Similarweb, Semrush and Ahrefs can estimate traffic volumes, top-performing pages, referral sources and keyword rankings for any publicly accessible website. They offer directionally accurate data, although the estimates can be off.

 Connexion